:ir_start
if '%1'=='' goto end
set winpath=%~dpn1
for /f %%i in ('wsl wslpath "%winpath%"') do set linpath=%%i
set /A filecount=%filecount%+1
cd /D %~dp1 > nul
bash -c "/mnt/c/orca/orca_mapspc %linpath%.out ir
(
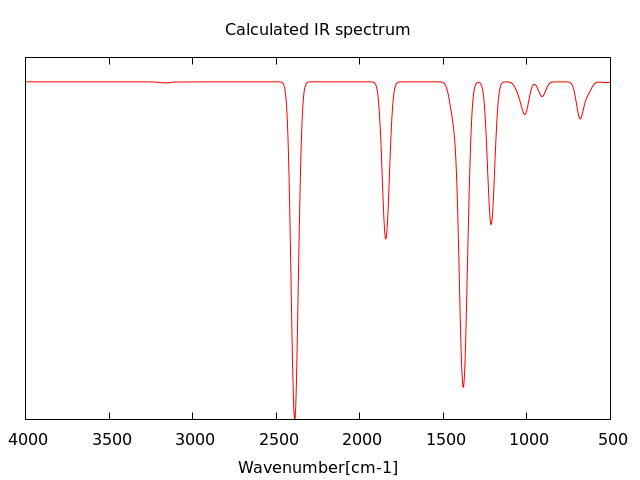
echo set title "Calculated %gtitle%"
echo set xlabel "Wavenumber [cm-1]"
echo unset key
echo set xrange[4000:500]
echo set yrange[:1050]
echo unset ytics
echo set terminal pngcairo
echo set output "%linpath%.%spectrum%.png"
echo plot "%linpath%.out.%spectrum%.dat" w l lt rgb "red"
)> temp_%spectrum%.plt
bash -c "gnuplot temp_ir.plt"
del /Q temp_ir.plt
shift
goto ir_start
:end
exit
# common setting
set terminal pngcairo
set output "IR.png"
set lmargin 0
set rmargin 0
set tmargin 0
set bmargin 0
unset key
set multiplot
# title and x-axis tics/label
set title "IR spectrum
set size 0.8, 0.7
set origin 0.1, 0.2
set xrange [0:5]
set yrange [-500:1050]
unset border
set xtics ('4000' 0, '3000' 1, '2000' 2, '1500' 3, '1000' 4, '500' 5)
unset ytics
set xlabel "wavenumber [cm-1]"
unset ylabel
plot 1000 w l lt rgb "white"
# large wavenumber side
unset title
set size 0.32, 0.7
set origin 0.1, 0.2
set xrange [4000:2000]
set yrange [-500:1050]
unset xtics
unset ytics
unset ylabel
unset xlabel
set border 7
plot "xxx.out.ir.dat" w l lt rgb "red"
# small wavenumber side
unset title
set size 0.48, 0.7
set origin 0.42, 0.2
set xrange [2000:500]
set yrange [-500:1050]
unset xtics
unset ytics
unset ylabel
unset xlabel
set border 13
plot "xxx.out.ir.dat" w l lt rgb "red"
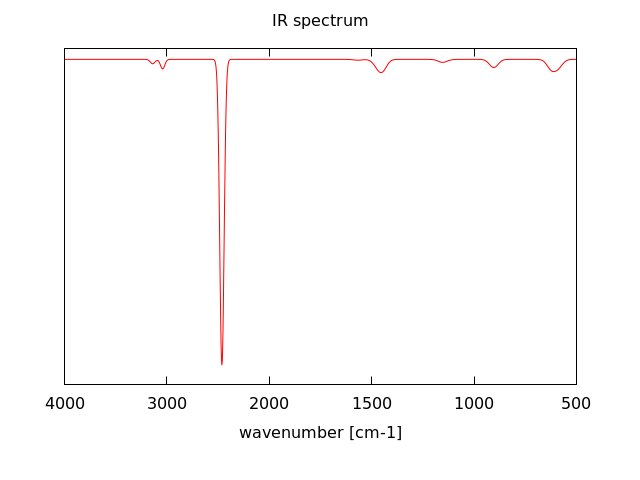
unset multiplot
以下のようなグラフが出力されます。
4種のスペクトル対応版batファイル
@echo off
title Drawing spectrum from ORCA output
set filecount=0

rem 処理するスペクトルデータの種類
echo 1=IR, 2=UV/Vis, 3=Raman, 4=CD
set /P userinput="出力するスペクトルの種類を選んでください:"
if %userinput%==1 (
 set spectrum=ir
 set gtitle=IR spectrum
 goto ir_start
) else if %userinput%==2 (
 set spectrum=abs
 set gtitle=UV/Vis spectrum
 goto abs_start
) else if %userinput%==3 (
 set spectrum=raman
 set gtitle=Raman spectrum
 goto raman_start
) else if %userinput%==4 (
 set spectrum=cd
 set gtitle=CD spectrum
 goto cd_start
) else (
 echo ※上記4種類以外のスペクトルは扱えません
 goto end
)

:ir_start
if '%1'=='' goto end
set winpath=%~dpn1
for /f %%i in ('wsl wslpath "%winpath%"') do set linpath=%%i
set /A filecount=%filecount%+1
cd /D %~dp1 > nul
bash -c "/mnt/e/Programs/orca/bin410_ls/orca_mapspc %linpath%.out %spectrum%"

(
echo set title "Calculated %gtitle%"
echo set xlabel "wavenumber [cm-1]"
echo unset key
echo set xrange[4000:500]
echo set autoscale y
echo set y2range[] reverse
echo unset ytics
echo unset y2tics
echo unset x2tics
echo set xtics nomirror
echo set terminal pngcairo
echo plot "%linpath%.out.%spectrum%.dat" axis x1y1 w l lt rgb "red"
echo set output "%linpath%.%spectrum%.png"
echo replot "%linpath%.out.%spectrum%.stk" axis x1y2 w impulse lt rgb "gray50"
)> temp_%spectrum%.plt

bash -c "gnuplot temp_%spectrum%.plt"
del /Q temp_%spectrum%.plt

shift
goto ir_start

:abs_start
if '%1'=='' goto end
set winpath=%~dpn1
for /f %%i in ('wsl wslpath "%winpath%"') do set linpath=%%i
set /A filecount=%filecount%+1
cd /D %~dp1 > nul
bash -c "/mnt/e/Programs/orca/bin410_ls/orca_mapspc %linpath%.out %spectrum%"

(
echo set title "Calculated %gtitle%"
echo set xlabel "wavelength [nm]"
echo unset key
echo set xrange[250:1000]
echo unset ytics
echo unset y2tics
echo unset x2tics
echo set xtics nomirror
echo N=10000000
echo set terminal pngcairo
)> temp_%spectrum%.plt
echo plot "%linpath%.out.%spectrum%.dat" using (N/$1):2 axis x1y1 w l lt rgb "red" >> temp_%spectrum%.plt
echo set output "%linpath%.%spectrum%.png" >> temp_%spectrum%.plt
echo replot "%linpath%.out.%spectrum%.stk" using (N/$1):2 axis x1y2 w impulse lt rgb "gray50" >> temp_%spectrum%.plt

bash -c "gnuplot temp_%spectrum%.plt"
del /Q temp_%spectrum%.plt

shift
goto abs_start

:raman_start
if '%1'=='' goto end
set winpath=%~dpn1
for /f %%i in ('wsl wslpath "%winpath%"') do set linpath=%%i
set /A filecount=%filecount%+1
cd /D %~dp1 > nul
bash -c "/mnt/e/Programs/orca/bin410_ls/orca_mapspc %linpath%.out %spectrum%"

(
echo set title "Calculated %gtitle%"
echo set xlabel "wavenumber [cm-1]"
echo unset key
echo set xrange[4000:300]
echo unset ytics
echo unset y2tics
echo unset x2tics
echo set xtics nomirror
echo set terminal pngcairo
echo plot "%linpath%.out.%spectrum%.dat" axis x1y1 w l lt rgb "red"
echo set output "%linpath%.%spectrum%.png"
echo replot "%linpath%.out.%spectrum%.stk" axis x1y2 w impulse lt rgb "gray50"
)> temp_%spectrum%.plt

bash -c "gnuplot temp_%spectrum%.plt"
del /Q temp_%spectrum%.plt

shift
goto raman_start

:cd_start
if '%1'=='' goto end
set winpath=%~dpn1
for /f %%i in ('wsl wslpath "%winpath%"') do set linpath=%%i
set /A filecount=%filecount%+1
cd /D %~dp1 > nul
bash -c "/mnt/e/Programs/orca/bin410_ls/orca_mapspc %linpath%.out %spectrum%"

(
echo set title "Calculated %gtitle%"
echo set xlabel "wavelength [nm]"
echo unset key
echo set xrange[250:1000]
echo set autoscale y
echo unset logscale y
echo unset ytics
echo unset x2tics
echo set xtics nomirror
echo N=10000000
echo set terminal pngcairo
echo plot 0 w l lt rgb "black"
)> temp_%spectrum%.plt
echo replot "%linpath%.out.%spectrum%.dat" using (N/$1):2 w l lt rgb "red" >> temp_%spectrum%.plt
echo set output "%linpath%.%spectrum%.png" >> temp_%spectrum%.plt
echo replot "%linpath%.out.%spectrum%.stk" using (N/$1):2 w impulse lt rgb "gray50" >> temp_%spectrum%.plt

bash -c "gnuplot temp_%spectrum%.plt"
del /Q temp_%spectrum%.plt

shift
goto cd_start

:end
exit
Leave a Reply
コメントを投稿するにはログインしてください。